Reporting of vessel operations
Vessels generate, daily, a substantial amount of data involving vessel operations, maintenance and repair activities onboard, crew changes and cargo status, to name a few. These information elements are collected, primarily, by hand, and delivered to shore by email or handed over when arriving at the port. One example is the noon report. It consists of a data sheet describing the position of the vessel, type of operation and some performance indicators.
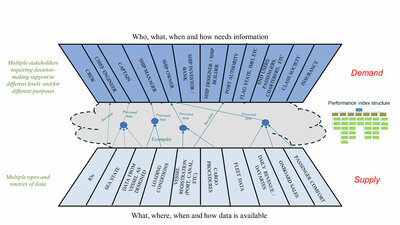
Shipping operations have become more complex over time, and what use to be a “one-sheet” daily report has become a comprehensive summary of information that cover the needs and expectations of the different stakeholders onshore. This complexity is reflected in Figure 1, with sources of data at the bottom of the figure and users of data at the top. In some cases, data needs to be processed (make calculations, average, accumulated), while in others it will be presented as raw. The fact that different stakeholders require different information and that the amount of information is continually increasing is making the creation of daily reports a paramount task.
From reporting to monitoring
Data transferring capabilities and the rapid development of the maritime industry are guiding vessel operators, regulators, and cargo owners to request real-time information on the status of the vessel. Daily reports alone are not enough, and the ability to know where, what, and how the vessel is performing at any point in time is gaining weight and focus.
The shipping industry has already developed multiple solutions for real-time data retrieval and monitoring. Yet, many of them require high investments or a high degree of specialization for their use. Vessel monitoring shouldn’t be complex, nor require large investments.
Four-steps for implementing data monitoring and reporting
Implementing effective vessel operations monitoring and reporting requires a clear strategy. We suggest a four-step approach:
- Who needs information? Identify relevant stakeholders
- What do they need? Define objectives
- How to measure objectives? Specify performance criteria
- Where can we get relevant data? Identify relevant data to describe performance
Who needs information? After every report, there is a stakeholder who has requested it or who use it for a purpose. It is important to identify them and understand intended use of data. What do they need? Data can be used to validate and verify the performance of systems, identify improvement potentials, or simply to be stored.
Understanding the purpose of monitoring and reporting operational data is critical for the analyst that will develop the reports and dashboards. The next step is to specify the performance criteria. How to measure objectives? A stakeholder might have as criteria a reduction of CO2 emissions. These can be measured in absolute values – tonnes CO2 per day, or in relative terms - tonnes CO2 per tonne of cargo, tonnes CO2 per mile, or tonnes CO2 per tonne of cargo and nautical mile. The way of how data is presented (table, graph, histogram) is also very important in the efficiency of communication.
Identifying relevant signals and data sources in the last step. Where can we get relevant data? Modern vessels have from a few hundred to several thousand data signals. Keeping control and monitoring from shore all those signals represents a major challenge. However, in our experience, we can achieve a lot with only a handful of those. Knowing what we want to measure makes it easy to select relevant signals. At this stage, we also need to evaluate what level of detail is sufficient. Do additional details increase the value to the end-user? Be critical.
Following this four-step approach will ensure an effective and efficient data monitoring and reporting process. In other words, it will ensure that the achievement of the right objectives, with the right level of resources!
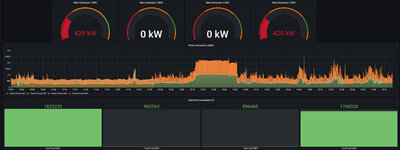
If you have reached this stage, you are ready to monitor and create automatic reports of your vessel operations. Then you just need to select a visualization tool and get started!
Would you like to know more?
Explore our featured articles below or get in touch.
We are eager to explore how digitalisation possibilities can improve the effectiveness of your vessel operations.